I am currently reading Jo Boaler’s book Mathematical Mindsets. It has reminded me not just of my school days when I was studying Math but also made me look forward into the future and ask myself of what kind of math teacher I want to be? A question that was asked when I started my teaching degree was whether there was a teacher who I liked the most and why. I mentioned my Grade 8 Math teacher. She was caring, she asked thoughtful questions, we did a lot of hands on work in her class, especially for geometry, she made sure that everyone was following and she never scolded anyone or made them feel like less when they made a mistake. I would attribute my love of Math partly to her.
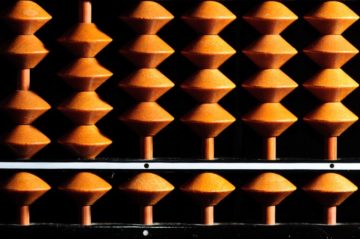
The other reason I love Math is because during my middle school years, my mom put in an Abacus program. I was in Grade 7 and I started Math from scratch — counting, addition, subtraction, multiplication. I did not end up completing the program but the Abacus was a great visual aid and one of the techniques was to imagine it in your head for calculations. It was a different way of doing math and thinking about math even though we did not solve word problems or make graphs. I still use it sometimes.
Jo Boaler mentioned a very interesting observation in Chapter 3 of her book: that the math taught in schools is far removed from the math that mathematicians use and that students get this impression that math is all about calculations and being fast rather than intuition and making sense. Her account of a math PhD defense made me think about my own research experience even though it is in Computing Science and not Math. I agree with her that the math we teach is too broken down into what constitutes math and not the big picture.
My attempt today is a first look at a research based approach to teaching Math. I recently heard about the KLEWS strategy of teaching in STEM and I will use it as a tool to get students to develop their mathematical thinking and reasoning.
The KLEWS Strategy – a way to research
The KLEWS chart was developed by Carla Zembal-Saul and her colleagues at the University of Pennsylvania. Their book, What’s your Evidence? is a great introduction to the technique.
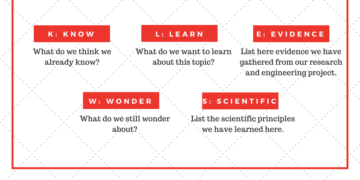
KLEWS is driven by an overarching question that is being investigated to develop claims. The KLEWS chart consists of the following columns which do not have to be completed in order:
- K=What students know: This could be prior knowledge that they come with, things they have heard and are unsure of but trust because of the source of information.
- L=What are we learning?: This refers to the patterns and conclusions reached from the evidence. These are claims that will help answer the overarching question.
- E=Evidence they learned through observation: This is generally filled in tandem with the L column. This could include observations, experimentation results and calculations.
- W=What students wonder about: These are questions that arose out of their investigation. This is a natural part of the process of research as it often leads to more ideas and the need to know more, to understand the world better and ‘why’.
- S=Scientific understanding: this could be the name of the relationship that they uncovered.
KLEWS chart allows a visual aid for students to refer back to and relive their investigation process. A digital copy may be purchased from here.
Applying KLEWS to Math
What do you do when you come across a framework or idea that can be applied to the whole/part of the curriculum? What is the first step that you take?
I have lots of ideas and I strive to organize them and bring them into physical form yet I get caught up in the details of making a lesson plan or figuring out how much time this should take and materials I will need and so on. When I asked the above questions to my Math Curriculum Design instructor, she said to just write down my idea somewhere where I can find it again and add to it. It doesn’t have to be a lesson plan, it just needs to be described well enough that I can develop lesson plans from it and it should say which grade, objective, learning outcome I am aiming for.
For this first attempt at research-based learning, I chose the relationship between a circle’s radius and its circumference. This is taught in Grade 7 in Alberta (Program of studies for K-9 Math, pg 43).
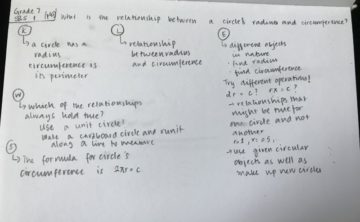
Overarching question: What is the relationship between a circle’s radius and circumference?
K: We know what a circle is, that every circle has a radius and that circumference of a circle is what perimeter is to a square.
For L and E, the students will be given a variety of objects: cans, circular mirrors, bangles. Each student will choose one. Strings and rulers will be used to help students measure the radius and circumference of the objects and record them.
L: possible relationships that they see true between the chosen object’s radius and circumference.
E: Measured values of radius and circumference.
W: Does this relationship hold true for a different object?
When it turns out the relationship they found was not true for a new object, they might go back to E and L and think of a different relationship. As a class, brainstorming relationships and being able to disprove some and prove others is a great evidence-based approach.
S: Once the students find out that the ratio between circumference and radius is always twice of pi, the relationship can be written on the board as the final answer to the question. Taking this a step further, I would give everyone a unit circle and we will measure this circumference of this circle and then talk about how the circumference changes as radius increases and the role of the diameter.
I love the second visual that Wikipedia has and having everyone try it out would be a good conclusion to this activity.
Inquiry-based learning is achieved by posing questions to the students rather than giving them the facts right away. I find KLEWS to be trying to do the same. Research and experimentation is at its heart. I hope that this example gave you a first start at how KLEWS can be used in the math classroom, showing students the steps in researching a problem, finding relationships on their own and able to explain why and how. If there is at least one such activity for each unit, won’t math become more about discovery than about learning formulae? 🙂
Have you used KLEWS or another strategy in your classroom? Please share your experience by contributing an article to A Teacher’s Hat or pointing me out to the strategy to learn more by filling the contact form.
Be First to Comment